What's New?
Supported Operation Systems:
-
Solaris 10 - Support for Patches (patch removal is not yet supported - known issue)
-
Solaris 11 - Support for Patches (patch removal is not yet supported - known issue)
-
SUSE Linux enterprise server 11SP4- Support for Patches and Agents (patch removal is not supported - known issue)
-
SUSE Linux enterprise server 12 (All service packs) - Support for Patches and Agents (patch removal is not supported - known issue)
For more information on supported OS's and patching downloading techniques please visit JetPatch Supported Platforms
ITSM Integrations
-
ITSM Approval Status Update Configuration: You now have the option of choosing how JetPatch will communicate with your ITSM. After a Remediation Plan is created an approval request is send to your configured ITSM and JetPatch will get a status update in one of these three ways:
- Polling (default setting): JetPatch will check every five minutes to see if there is an update
- Auto Patching: Once a remediation plan is created and was sent for approval the plan will be executed automatically and will not wait for a response.
- Waiting for External Response: JetPatch will send one approval request and then wait for a response on the ITSM ticket.
For more information please visit our Knowledge Center ITSM Approval Status Update Configuration
- JIRA/ Atlassian
- Service Now
- Symphony Summit - NEW!
Multiple Vulnerability Scanners:
JetPatch is integrated with several vulnerability scanners that are constantly being updated, making your environment more secure.
In addition to our updates, you can now import vulnerability information independently. This new feature will enable you to create your own vulnerability reports, that can be filtered by and also used to create remediation plans.
Lastly, we updated the endpoint management table to include two numbers from a Vulnerability provider. The two numbers are the total number of patches and the number of patches needed on that endpoint. Example: There are 16 patches needed on the Endpoint out of 23 patches as per the Nexpose vulnerability report.

For more information visit our Knowledge Center:
Predictive Patching - NEW!
This exciting new feature will enable you to predict the success rate of your patching cycle. Before deploying the actual patch cycle you run a simulation of the patching process and receive a comprehensive report detailing your expected success rate as well as the issues that need to be addressed.
For more information visit our Knowledge Center: Predictive Patching

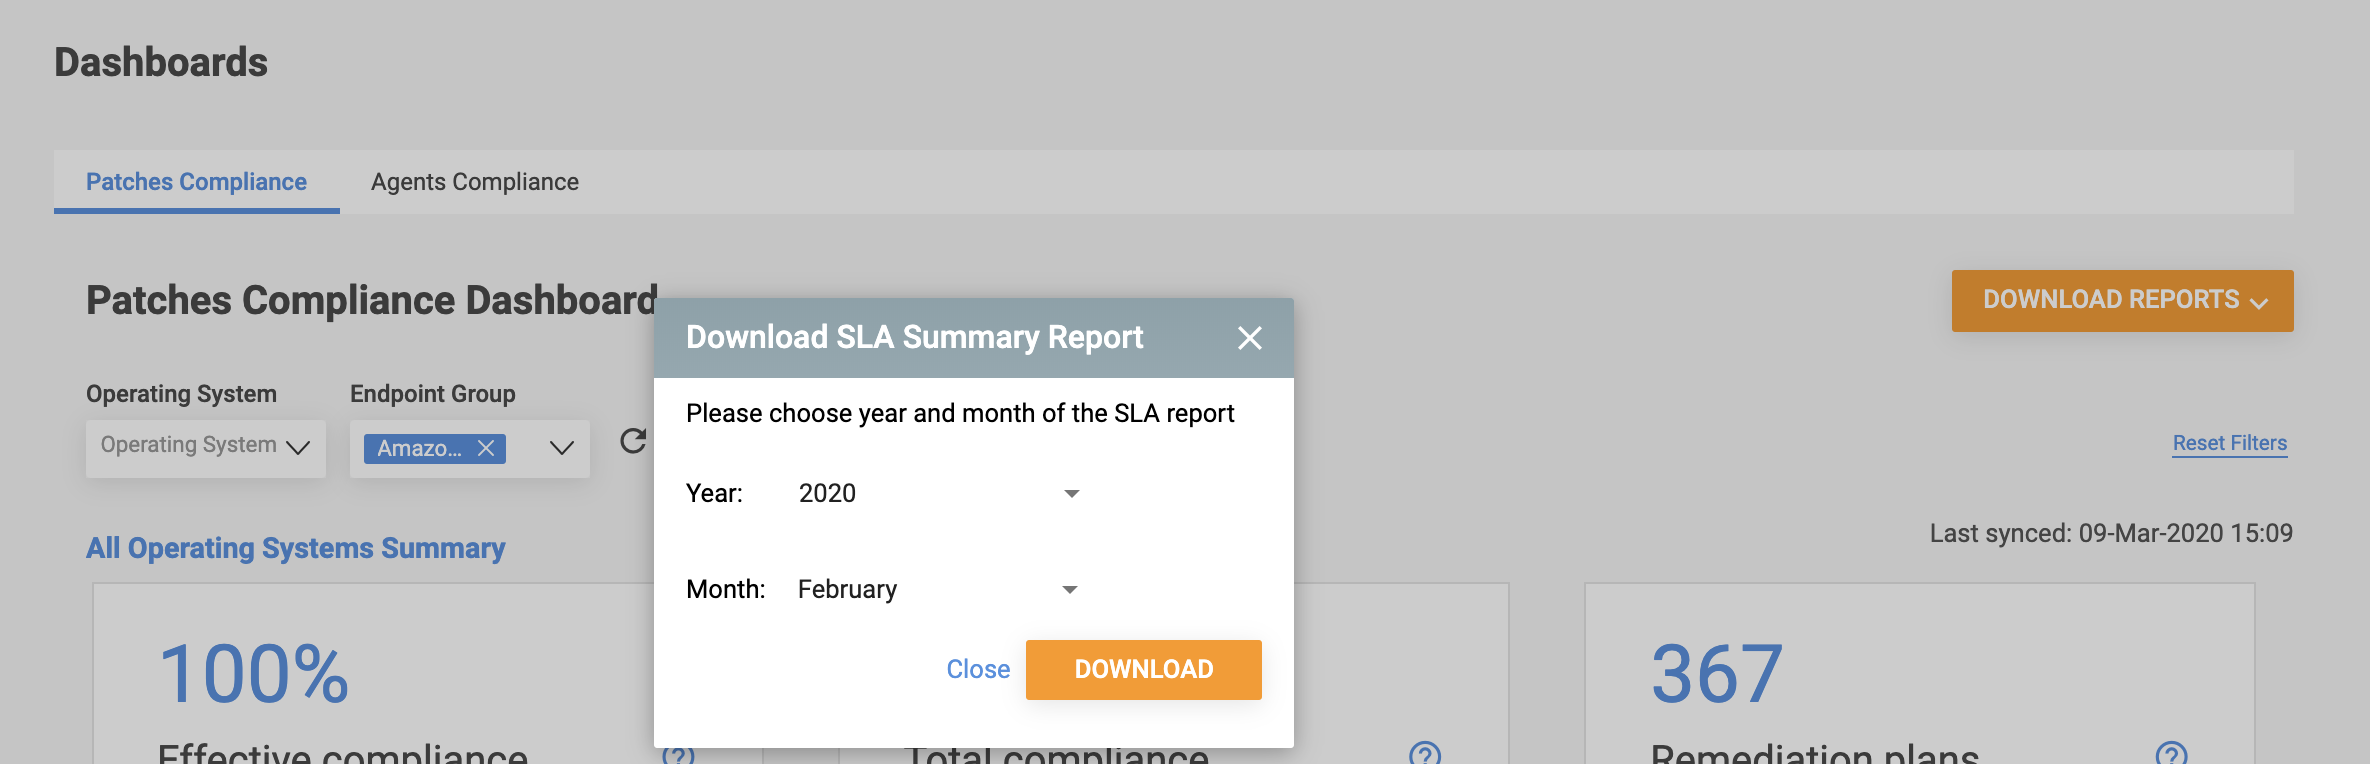
SLA report - NEW!
This new monthly report provides an overall update on all active remediation plans were the planned end dates fall within the selected month.
For more information on how to create the SLA report please visit : Generate SLA Report
UI Changes
The JetPatch portal has been upgraded and has a new Look & Feel.
In addition to our brand new tabs such as we have also changed the existing ones.
Policy and Tools
We have consolidated the "Policy and Tools" portal into the JetPatch portal. The same functionality exists just in a new and improved location.
- Jet Agent compliance dashboard can now be found under Dashboards in the JetPatch portal menu.
- Tools Catalog and Tools Exceptions are now under a new Tab Agents & Tools in the JetPatch portal menu.
- Activities can be found under Endpoints

We also changed the Tasks and Scripts tabs

Run Tasks from Management Table
You can now run tasks directly from the management table
To do so, select an endpoint and click on "SELECT ACTION", then choose "Run Task" and execute your tasks.

Improved Activities Table
Additional Filters
We improved the JetPatch Activities table with lots of new filters, like "Exit Code", "Task Type" and "Operating System".

Queued Activities
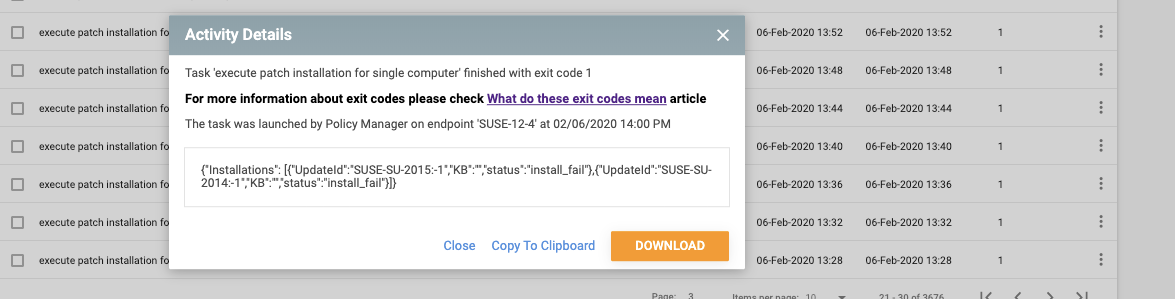
The activity library contains a list of all the Tasks/Patches and their statuses, only activities that are queued can be canceled.

Added Exit Code documentation link - for failed activities, there is now an easy way to get more information on what these exit codes mean and what you can do next.
Other UI Enhancements
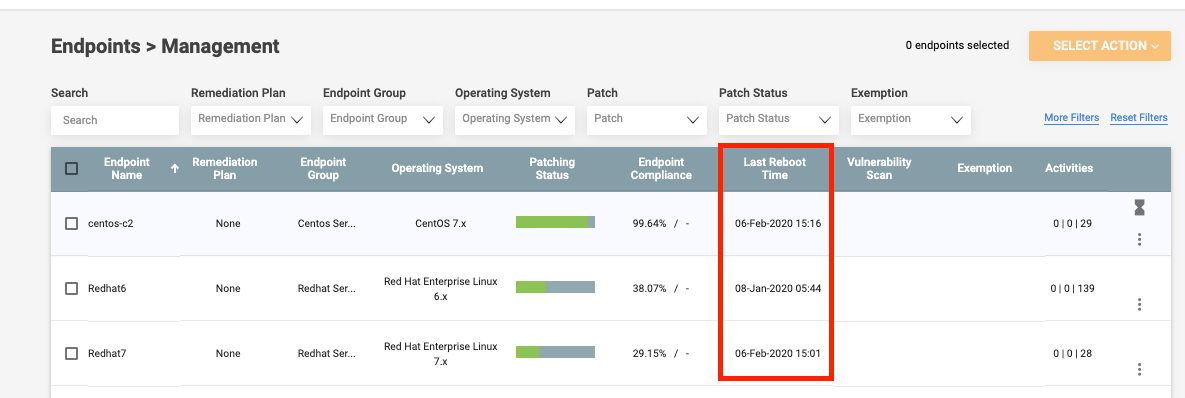
Last Reboot time column - You can now see the last time an endpoint was rebooted
Go to: Endpoints > Management
Increased number of Items per page across all tables - You now have the ability to choose the number of items shown

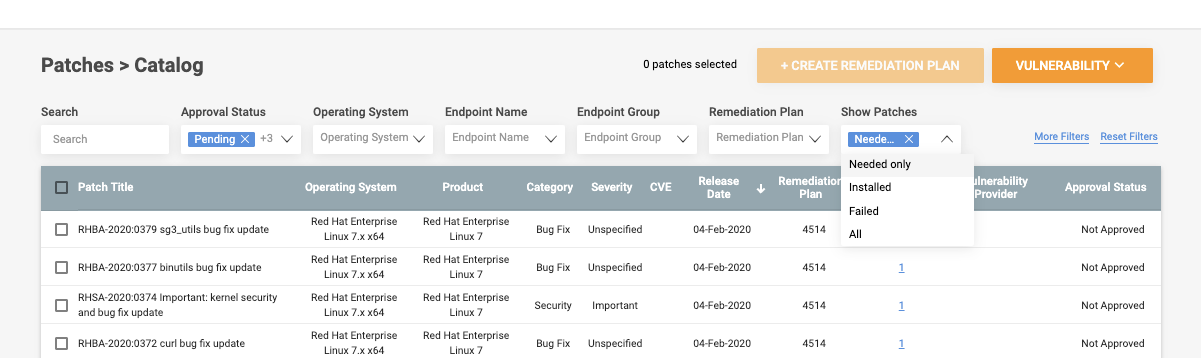
Enhanced Show Patches filter in the Patches Catalog tab - Now you can filter by Installed and Failed patches
Go to: Patches Catalog > Show Patches
Enhanced Severity filler in the Patches Catalog tab - Now you can checkbox filter severity.
Go to: Patches Catalog > More Filters > Severity

Updated Compliance Report - added the next maintenance window starts and ends
You can view the next start and end time under the Applicable Endpoints Compliance Status

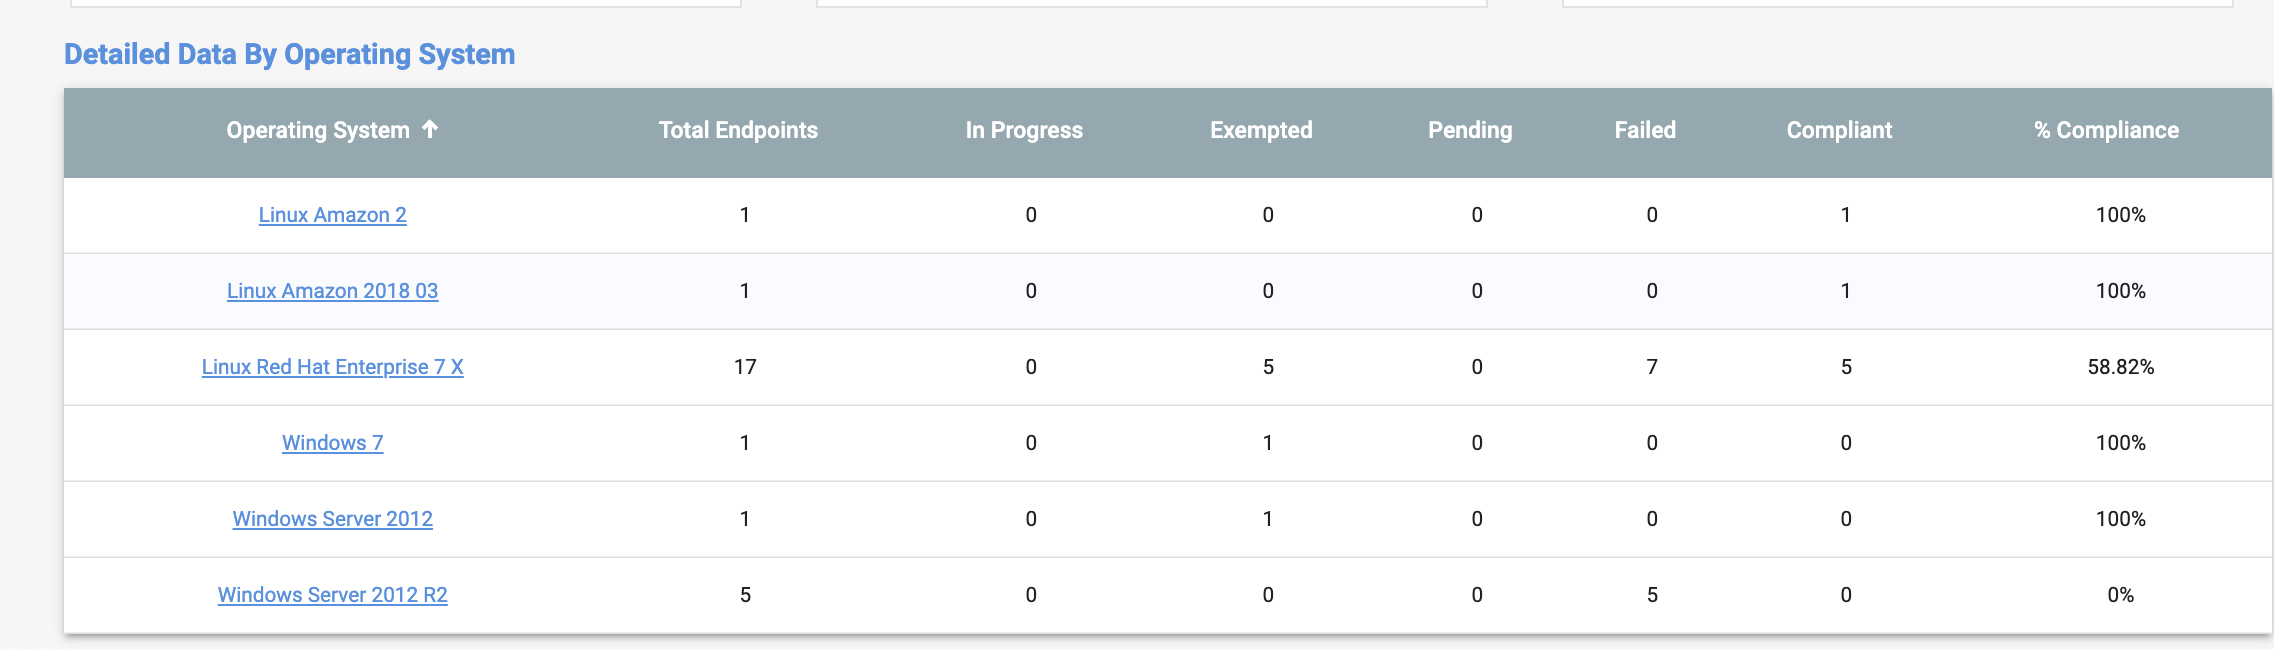
Updated Compliance Dashboard - Operating Systems are now clickable and redirects to “Endpoints Management” with the chosen operating system as a filter.
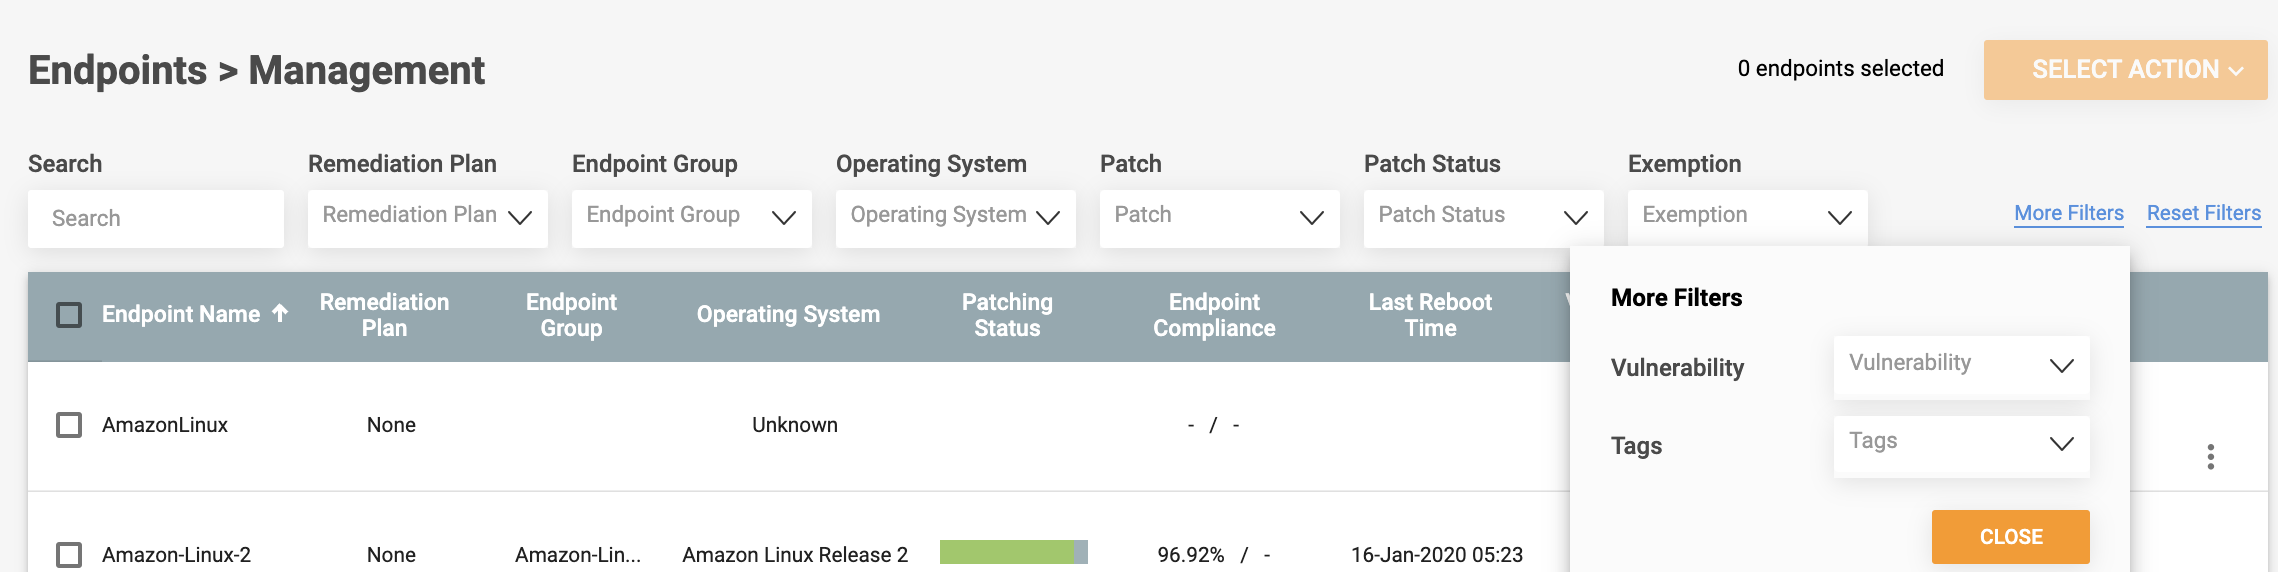
Tags Filtering - Added the option to filter endpoint Tags under Endpoint Management Maintenance and Groups


Updated Time Zone List: Updated timezone list to choose from.
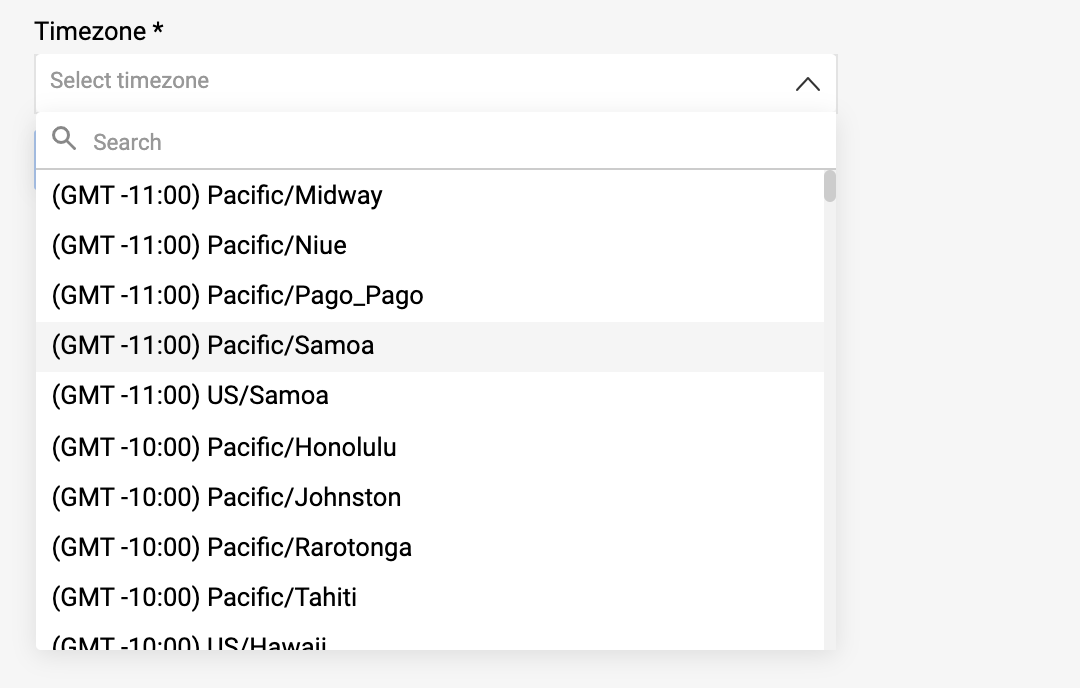
Updated Time Zone information can be viewed in the following places
- Endpoints > Management > Select Action > Set Suspension - Timezone List
- Endpoints > Maintenance - Timezone Column
- System > Maintenance Schedules - Create Maintenance Schedule - Timezone List
- Compliance Report Remediation Plan >Endpoints Compliance Status > Time Slots - Timezone Location
Other Enhancements
New Reboot Scripts
We added a Reboot script to our built-in scripts to our library to support Windows, Linux and Solaris reboot
Go to: Systems > Scripts > Filter built-in

Builtin Tasks Timeout Change
The default timeout for tasks has been changed:
-
WSUS Discovery Source and "WSUS Get Updates" - the timeout was raised to 3 hours. Note - the default timeout can be overridden by a configurable value. Please see WSUS Script article for more information.
- Execute Patching Script (Windows, Solaris and Linux) - the timeout was raised to 3 hours.
- Collect Endpoint Updates Tasks (Linux, Solaris) - the timeout was raised to 1 hour.
- Learn more about scripts timeout configuration
Improved JetPatch communication to endpoints
The files protocols communication from JetPatch to the endpoints in the environment can be restricted using IP ranges. For setup, information see article.
RPM Enhancements
The RPM Intigua-va was renamed to intigua-python-client. The RPM will be replaced automatically on upgrade. The new intigua-python-client RPM depends on python v.3.4. Please note this python RPM is optional and not a requirement. For more information please visit our Knowledge Center: JetPatch RPMs
Known Limitations:
- Solaris 10/11 connector does not support upgrade operation - The workaround is to uninstall the current version and then install the new version.
- Declined patches are part of the endpoint compliance status - A declined patch is taken into account when an endpoint compliance calculations are done. This is reflected in two places:
- The Remediation Plan compliance report
- The Management table under Patching status
- Select the "Select All" option within a filter drop-down may cause different results than expected.
- Emergency Remediation Plan displaying inconsistent information in Remediation plan board
- In some cases, the information displayed on an Emergency Remediation Plan may contain the information related to the original maintenance windows (related to the servers on the plan) and not the emergency maintenance window. This information will appear in three places only: Devices Status, Actions Status, Remediation plan status. All the other related information, the column the plan is in, related compliance report or the view tab, is correct.
-
"Repeat Until" date cannot be deleted - When creating a maintenance window once a Repeat Until Date is select it cannot be deleted.
-
"View Intigua Logs" for Solaris endpoints may not work - The workaround is to download the logs by clicking the "Download Intigua Log Package".
Comments
0 comments
Please sign in to leave a comment.